Saturday, November 27, 2021

A Concept Network Analysis Of Upstart Holdings Inc. - Connecting The Dots


Summary

  • Here in is presented a novel method to analyze underlying business to understand connections, synergies, scale, shared strategic resources & inter-dependencies that may make UPST a stellar company.
  • This type of analysis is complementary to the conventional methods of fundamental or technical analysis, and lets semantic data reveal the patterns and relationships. Connect the dots.
  • Based on my concept analysis, Upstart Inc is a disruptor, filling an unmet need. It has the vision and an operating mechanism for growth.
Small Network of Pins

anilakkus/E+ via Getty Images

A deep dive into Upstart Holdings Inc. (Ticker: UPST). Network analysis of concepts fiscal quarter end June 2021.

Introduction

There are many services that provide stock or company analysis, those analysts choose either fundamental data (numbers like profit, loss, revenue etc.) or technical analysis (stock price action) which are important for evaluation of the company. This article is not it.

This article presents a method to understand the underlying business and to get a sense of connections, synergies, scale, interconnections, shared strategic resources and inter-dependencies that make a company successful.

Background

In graph theory, a graph (network) is a structure containing a set of objects in which the objects are in some sense “related”. The objects can be ideas, concepts, discrete elements. I use visual and network analysis in medicine and biology to analyze relationships between proteins, genes, diseases etc. I am applying similar principles to do deep dives of companies to analyze companies to invest in.

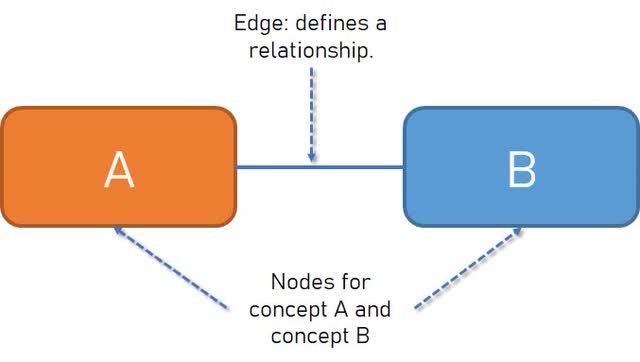
A network graph is made of nodes and connections (edges). Each node is a tangible concept or entity. Lines connecting the nodes are relationships between any two entities are called edges. Thus, if 2 entities are related, there is a line (edge) connecting 2 nodes. In the most reductive sense, this is represented in the figure 1, with 2 nodes and 1 edge. This type graph is an excellent tool to represent relationships between 2 ‘concepts’.
simple network

Figure 1: A simple network, concept nodes (A and B) connected by an edge relation

veuepoint (self)

These graphs are a non-random mathematical models of relationships. This process is unsupervised (no human bias) and lets the data reveal the patterns and relationships , allowing confirmation of the known and to reveal the unknown.

Such tools can help increase understanding and reading between the lines. In my opinion, this type of analysis is crucial but severely lacking. Intangibles like company work culture, mission, flywheels, synergies, leadership can be “discovered” by such tools. With this background, lets analyze the concepts presented in the conference call for fiscal quarter ending June 2021 (UPST)

Unsupervised concept network analysis of Upstart and its AI platform
A network map of Upstart Inc

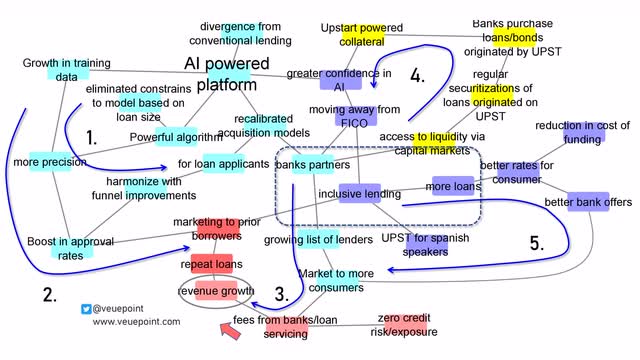
Figure 2: The entire unsupervised network of concepts related to Upstart AI platform

Veuepoint (self)

The above figure is busy so let me break it down into ‘smaller models’ which lets us look at it in detail.
Concept mapping of Upstarts AI platform

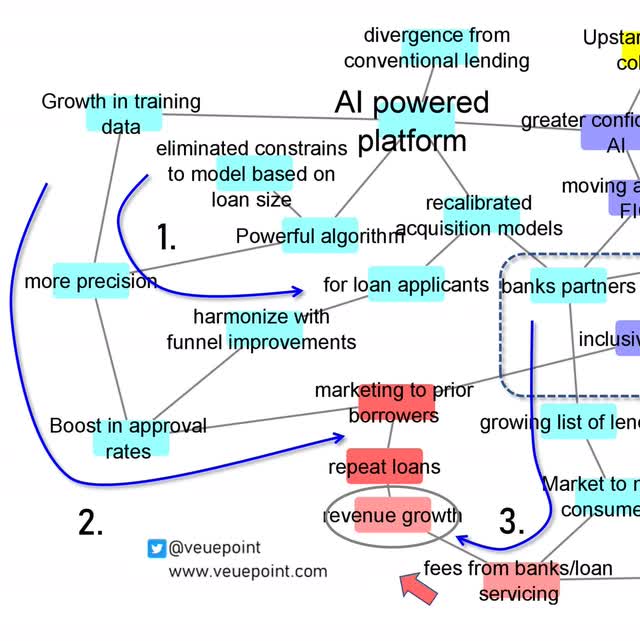
Figure 2A: Upstart AI platform concept analysis closer look at concepts 1, 2 and 3

Veuepoint.com (self)

1) A platform (and the business) which gets better over time.

This section of the network model shows the amazing internal flywheels that are synergistic to the workings of Upstart. Lets begin with our attention to the left of the figure (blue arrow #1). This section describes the AI platform and the developments that upstart has implemented for it. The AI platform is a self learning entity, the more data it processes the better it gets at making decisions. This growth in training data leads to more precision and then in turn leads to a boost in approval rates for applicants. This leads to more loans being approved which in turn leads to refinement of the algorithm. Thus one can envision, this process to get better and better over time, and be able to identify those applicants which are loan worthy but missed by other scores (Like FICO).

2) Revenue growth multipliers

The next concept that is evident from the network map is shown by blue arrow #2. Here the improvement in AI algorithm, translates to revenue growth. This is achieved by the intermediary steps of increased precision, leading to boost in approval rates, leading to approving more borrowers. The company also has stated emphasis on marketing to prior borrowers. This is an excellent strategy since they have already qualified by upstarts AI and have demonstrated the ability to pay back the loans. These repeat loaners add to revenue growth.

3) Increase in lenders adds to borrower related revenue growth

The third network concept is highlighted by blue arrow #3. This revenue growth is not only being increased by growth in first time and repeat loan applicants, it is also growing as the number of lenders increases. This allows the banks to market to more consumers and this provides fees from banks for loan servicing (Blue arrow #3). The important aspect of this revenue stream is that Upstart is able to achieve this growth with zero credit risk or exposure. This is borne by banks and not by Upstart.
Concepts 4 and 5, central tenet

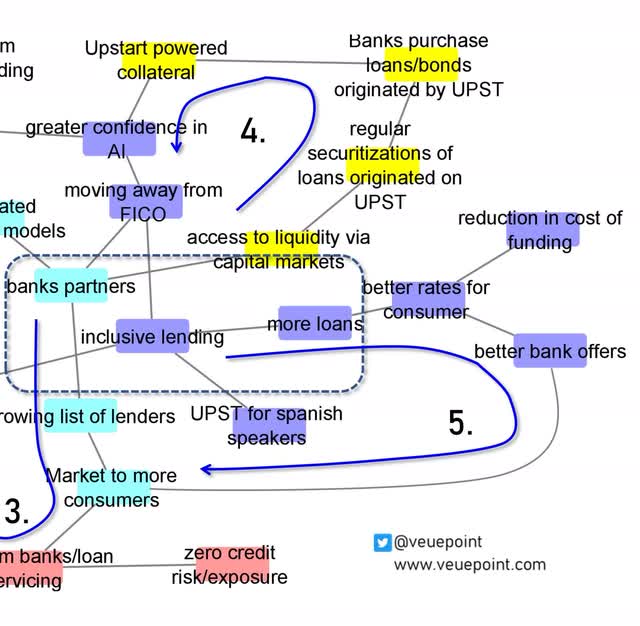
Figure 2B: Upstart AI platform concept analysis closer look at concepts 4 and 5

Veuepoint.com (Self)

4) Upstart powers collateral that partner banks can use

The fourth segment of this network is the part in yellow on top right and is an interesting one. Upstart is able to provide access to liquidity to banks by exposure to capital markets. The loans that originate at Upstart can be “securitized” and sold to banks that are willing to buy them. This upstart “powered” collateral that banks have (bonds, loans), allows banks access to more liquidity and capital.
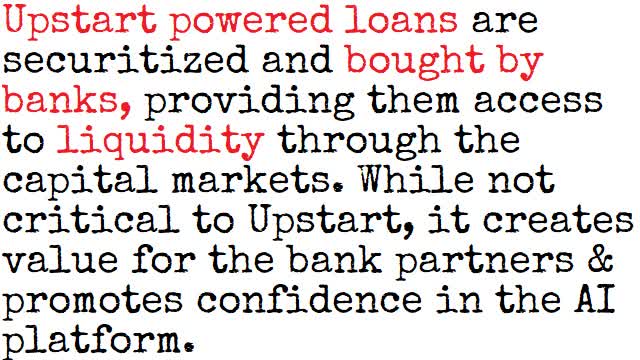
Upstart powered loans provide access to capital markets

Concept card 1: liquidity and access to capital markets

Veuepoint.com (self)

This is not necessary for working of upstart but provides an excellent service and value to the partner banks. This increases the working relationship that banks have with Upstart. This also has another benefit, as banks work with this upstart originated collateral, they are also demonstrating greater confidence in AI platform and this has lead to some banks discontinuing legacy scoring systems like FICO altogether. That is an exceptionally disruptive nature of the this arrangement.

5) "Inclusivity" revealed as the central tenet

The last segment of the network are the purple nodes on the right, this deals with the nature of the platform and its goal of inclusivity. As more loans are offered, upstart and bank partners are able to offer better rates to the consumer, leading to better offers from the bank and overall reduction in cost of funding the loan. This is a virtuous cycle which keeps working to improve at each iteration, lend more, to more eligible applicants and have them and banks get a better deal out of the transaction.

The network began with AI powered platform as the starting node. However, when all the concepts were linked and connected, the central nodes that seem to be the crux of the graph are bank partners – inclusive lending – more loans. This tenet is central to the working of the company and the network map generated by unsupervised non-random modeling was able to pin it down to this. Their mission to enable effortless credit based on true risk is acted on by a culture of “inclusive lending”.

Their modus operandi is exemplified by their mission statement “to enable effortless credit based on true risk. We are a leading artificial intelligence (NYSE:AI) lending platform designed to improve access to affordable credit while reducing the risk and costs of lending for our bank partners. Our platform uses sophisticated machine learning models to more accurately identify risk and approve more applicants than traditional, credit-score based lending models.”
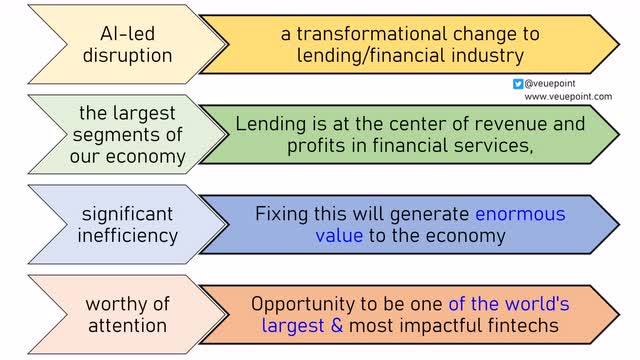
Key drivers of Upstart philosophy

Concept card 2: Upstart Key drivers and consequences

Veuepoint.com (self)

As seen in the figure above, the key concepts that drive Upstart have huge consequences. Lending is the center of revenue and profits in financial services. This is one of the largest segments of the economy. However, lending is fraught with inefficiencies. Artificial intelligence can assist in eliminating these inefficiencies. This can generate enormous value to the economy. AI powered lending could be the most transformational change for this industry and provides Upstart the opportunity to become one of the world’s largest and most impactful fintechs in the years to come.

But wait there is more..

Upstart auto lending could be the new hyper-growth venture.
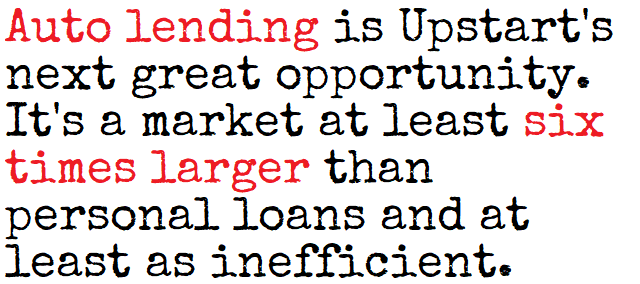
Autolending is six time bigger than personal loans

Concept card 3: Autolending is larger than Personal loans

Veuepoint.com (Self)

Upstart (UPST) recognizes the potential for growth in a related business by applying similar principles as personal loans to car loans. The figure below shows network model of concepts for auto lending. I will discuss key themes that stood out.
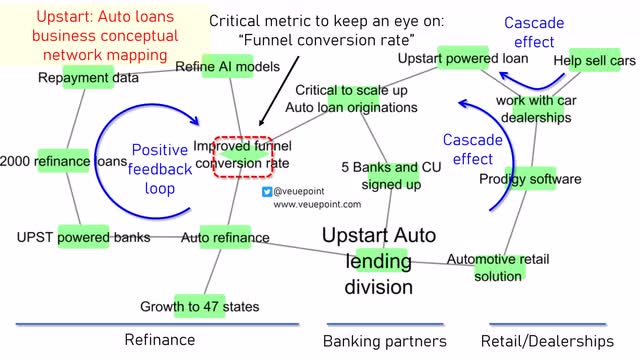
Autolending unsupervised network of concepts

Figure 3: Auto lending segment and Upstart concept network mapping

Veuepoint.com (Self)

A positive feed back loop

The auto refinance sector, via upstart powered banks offer loans to applicants. This is also based off their Artificial intelligence algorithm which makes a determination of eligibility just as it does in the personal loans space. As of their earnings update in August 2021, they had 2000 loans. The repayment data from these loans is utilized to refine the AI models, which can then in turn improve the funnel conversion rate. This is the rate of applicants who are approved for a loan over total number of applicants.

The company will continue to do exceptionally well, provided the percentage of applicants who are approved compared to the total applicants continues to grow. This will in turn increase the data of loan applicants, repayment data and further refine the AI to improve the detection on ideal applicants. This is noted as a “positive feedback loop” or a “flywheel effect”, similar to what was seen in the personal loans space. The best thing about this, is that the system keeps learning over time to better itself and make decisions with even better accuracy. The funnel conversion rate (noted as a diamond node) is a critical lynch pin in this network graph, since the positive loop is sustained only if the funnel conversion rate is positive and keeps improving.

A cascade effect of Prodigy, car dealerships and car loans

The second section of their auto lending concept map is the effect of Prodigy and its association with car dealerships (shown on right hand side of figure 4). Prodigy works with car dealerships to assist these businesses sell cars. It claims to streamline the process of car selling. The synergistic benefit of prodigy working with dealers to sell more cars is brought forth when a portion of these cars sold will also be financed through a upstart powered loan. The more cars prodigy helps sell, the more loans upstart can provide using its algorithm. This aspect of upstart is nascent and will continue to grow as more and more banks and credit unions sign up.

Overall, the concept maps exhibits good internal synergies and are sentiment positive.

A note on the work place philosophy at Upstart as a company.

Upstart is moving to a “digital-first model”, where most employees can live and work anywhere in the U.S. Besides the usual reasons for why hybrid or work from home has advantages for a place like Upstart, I would like to highlight a statement which is quite powerful as to the vision of what this company plans to do.Given the scale of our ambitions and the talent we need to aggressively pursue our goals, we need to tap into talent across the entire country”
Digital first model of Upstart allows work from home

Concept card 4: Upstart and digital first model

Veuepoint.com (Self)

Conclusions

The semantic/concept network mapping has revealed several unique strengths and none critical deficiencies

Actionable considerations

The above article is not financial or investment advice. It is sharing my method of evaluating companies. I have worked with network graphs for more than a decade with applications to other field, this is the first foray to publish its application to company analysis formally. Comments and feed back are welcome.

Based on my concept analysis, Upstart Inc is a disruptor, filling an unmet need. It has the vision and an operating mechanism for growth. I am invested in Upstart. The company narrative is exceptional and as long as this narrative continues, I will stay invested.


Disclosure: I/we have a beneficial long position in the shares of UPST either through stock ownership, options, or other derivatives.

I wrote this article myself, and it expresses my own opinions. I am not receiving compensation for it. I have no business relationship with any company whose stock is mentioned in this article

Sunday, September 26, 2021

Peloton (PTON): a comparative analysis of visitors to its website and competitors

This brief article looks at comparative web traffic to onepeloton.com, which is Peloton's homepage and the websites of its closest competitors.

Method: 

I chose Nordictrack, Myxfitness and Echelon as 3 closest competitors to Peloton, since they also provide hardware (exercise bikes, treadmills) and some form of subscription service. This study was performed to look at trends in website visitors to the respective home pages from around the world and see if there would be any insight gained. Data was complied from Cloudflare.com radar tool with a look back period of 30 days. 

Figure: Comparison of visitor location to website by country (Y-axis represents percentage)

Results: 

  1. The 4 companies were tied very close to each other for visitors origination in US. 
  2. Countries where Onepeloton.com was a leader were with visitors from Germany, Ireland and Sweden. Besides these three, it was not a leader in any of the other top countries studied. 
  3. Myxfitness.com was a leader for visitors from UK, Australia, the Netherlands, Japan and Georgia.
  4. Nordictrack was a leader for visitors from France, Singapore, India, and Hong Kong and seemed to have good penetration in Asia.
  5. Echelonfit.com was the leader when it came to visitors from Canada, Brazil, Poland, Colombia, Portugal and Austria. It had a the biggest share in South America.

Discussion

There did not seem much headroom for any of the companies when it came to website traffic for US. All of these had highest traffic percentage from US and it was close. The differences were most apparent when we looked at visitors from other countries. Australia which was recently opened up as a market for Peloton lagged behind Myxfitness and Nordictrack in this study. Echelonfit seemed to have a greater brand awareness and penetration in South America where it topped in both Brazil and Colombia.It was also the one with a dedicated .MX site. Nordic track had the greatest brand awareness in Asia, as suggested from highest percentage of visitors from Singapore, India and Hong Hong. Myxfitness led for visitors from Japan. There are some limitations to this study, most notable, the look back period is 1 month, second, website visitors does not always translate into customers but at least a small fraction of people visiting the website could be come potential customers for the services. Finally, VPN and proxy tools could affect the origination of web traffic but I would anticipate this would affect all the websites proportionally and this would be a minor issue for comparison. 

Disclaimer: I own shares of Peloton. As part of being a good investor, it is important to carefully evaluate investments from time to time. This is to assess if the companies you are invested continue to meet your expectations.


Saturday, September 25, 2021

Demystifying Palantir (PLTR) for a new investor

Background:

This article is an attempt to breakdown what Palantir does in a simple easy to understand manner. This article is not going to discuss the financial metrics or valuation of the company which is discussed here (Palantir Operating profitability and expense trends). I have also reviewed the numerous contracts that Palantir has won (as of Sept '21) since they became public. This article can be accessed here (A network of Palantir contracts). This piece is more about what it does in a hopefully simple to understand manner.

The word Palantir refers to a fictional magical artifact. J. R. R. Tolkien (of Lord of the Rings fame) imagined this to be an indestructible crystal sphere. Main use for this object was for communication and to see events in other parts of world (past or future). The name of Palantir Technologies is apt in its description of it capabilities. The ability to see what other can't see

So lets dig into what some of Palantir Technology does.

In its most basic function, 

Palantir's programs use computers and software to analyze information, identify and learn from the problem and devise solutions.

Palantir does some of this in part by collecting data from multiple sources, cleaning and making it usable, comparable. Finding patterns using visualization techniques. Then using the information using human intelligence or Machine learning (ML)/Artificial intelligence (AI) to solve the problem.

1) Helps with Data integration and  translation.

Palantir helps organizations to build a solid, high quality database from different sources. Palantir will translate the integrated data interactions in easy to read format. This of course comes with high degree of customization.

2) Helps with Data interconnections.

Data is often spread across the enterprise. Models derived from these disconnected data are difficult to comprehend. 'Micro Models' is a new approach developed by Palantir to address this problem. Micro Models addresses parts of a large problems. It then combines those solved parts back for a solution. Thus, it breaks a ‘BIG’ problem into smaller problems and solves all the smaller problems. Palantir software then chains those solutions together, to solve, the ‘BIG’ problem. The standardized solutions chain thus leads to interconnected workflows. 

3) Helps to Model Objectives.

Business objectives are clear targets and goals for a company to achieve. They may also include strategies achieve the said tasks.

Figure: Palantir keeps improving on the processes leading to objectives being met and improved

The objective model (OM) collects goals, training, evaluation data, result and metrics. This is in context of the underlying logic behind the objective. Thus, OM is a hub, receiving, transmitting and analyzing information about goal achievement. As  with micro-models, Palantir binds individual models to a larger design. This design powers several different workflows. The design has a 'write back' property to improve accuracy of future uses.  Thus, Palantir keeps refining the process, to ensure goal accomplishment and goal improvement.

4) Capable of building and deploying AI/ML Infrastructure

Palantir combines the data foundation (#1) with end-to-end AI/ML deployment infrastructure.  Think of these a AI/ML codes 'widgets' (each doing a specific task), placed at various points in a task workflow. Palantir allows scientists to decide where to place them. They also know how the widgets interact and check their function.  

5) Provides Artificial intelligence for Internet of Things and Edge computing.

Many electronic devices a.k.a 'things' use internet to stay connected  (e.g a smart thermostat, TV etc)  . This internet 'of things' (edge) usually communicates with a Cloud computing (center). Decisions go back to the IoT devices. This can be slow.  Palantir's 'Edge AI' powers decision at the edge detaching the cloud. Thus processing data is faster, with minimal lag, for immediate use. This Palantir tech is being used in ground vehicles, watercraft and spacecraft.

Applications:

The applications of such a technology are rather unlimited. Think of Palantir like a Swiss army knife a multipurpose tool for any number of applications.  I have highlighted some of the applications below

1) Solving financial crimes

Financial crime is complex. There are many moving parts, including the bad actors who are responsible for the crime. Also involved are intermediaries (banks/financial institutions) and victims (individuals and companies).   Criminals are also using newer and smarter ways to commit crimes. Hackers have held companies at ransom demanding cryptocurrencies. These innumerable data points make it difficult to track a financial crime. Conventional approach has been a 'fixed set' of rules with one lead leading to next, which leads to the next. This is labor and time intensive. Palantir provides tools to join billions of records to analyze data fast. Palantir’s enables linking of customers, networks, and counter parties. All this is compliant with privacy and security standards per Palantir. This system can allow banks to move away from the legacy systems. Palantir guides analysts through the investigation to focus on the most important risks. With this high level 30,000 foot view analysts can multitask the investigation. The analyst can addend the generated report to be filed with the authorities.

2) In automotive industry and racing

Palantir is working on its data analytics with Ferrari the car company. The vast number of data points are being used to make the cars safer, faster.

3) Use in Data protection

While data is being used for analysis, Palantir ensures that the data is secure. This is per the regulations that govern data privacy. This compliance with regulatory bodies allows continued use of data in correct manner.

4) Use in Defense and military applications

Palantir has worked for a long time with US armed forces. Its use is in principle the same.  Palantir integrates data external sensors/sources through a single point of access. This reveals unseen links across their entire universe of data. Palantir use if in Data Integration, Resource Planning, Finance & Accounting and Military Readiness.

5) Applications also include using Palantir software in energy sector.  

Energy companies deal with fluctuations in energy demand, transition to green energy. Palantir assists with these concerns by digitizing data and using it analytics.

6) Use in financial planning and analysis

Palantir queries, unifies, creates a usable database for financial management

Palantir has been used for analyzing troves of financial data to streamline expenses, budgets etc. It can query multiple disconnected systems for data, unify it into one harmonized database. This then lets it create a foundation database that finance professionals can use to analyze portfolio, audit finances, track budgets, reprogram funds and reallocate capital. This has been successfully applied to study contract renewals in US army.


7) Use in health sciences and medicine


Figure: How Palantir can transform medical discovery. The platform is flexible enough to be positioned at every sequential step of medical scientific process, enhancing efficiency and speed.

Palantir's foundry is a powerful tool that is being used currently for all aspects of medical progress. From basic sciences, pre-clinical studies including drug design and development, to developing cell clones Foundry can assist with data management. It also accelerates medical discovery by assisting in phase 0, I, II, III and IV clinical trials. Finally, data can be analyzed from post marketing information making Foundry indispensable for medical discovery. 

Conclusion:

Palantir's software (called Foundry & Gotham)  is a versatile tool which can be used in any industry, seeking solutions to problems which had previously been difficult problems to solve. The program does this by its unique approach of visualizing and finding patterns in data allowing either machines or humans to interact with the patterns for finding solutions. The sheer versatility and application is evidenced by its numerous contracts it has with industry in variety of sectors. 

Disclaimer: I own shares of Palantir. Information has been sourced from public websites.


Sunday, September 19, 2021

Global-E (GLBE) has an amazing mechanism to succeed

If you want to know what is to follow without reading  further, it is this: Global-E (GLBE) has an amazing mechanism to succeed. I am glad I own shares of this company. 

I was most interested in how the company works and how it is going to keep the flywheel(s) spinning. Using the information present in form F1 that was filed with SEC by the company (Sep-07-2021), I generated a unsupervised semantic network model. The figure is shown below,

Figure 1: An unsupervised network analysis of Global-E (GLBE) business overview based on SEC F-1 filing data

Figure legend:

  1. Merchant side concepts are shown as green nodes to the left
  2. Shopper side concepts are shown in pink nodes on right.'
  3. The edges, (lines) connecting the nodes are relations that were abstracted from the SEC filing.

Comments:
1. GLBE has plenty to offer the merchants (green square shape on left), which makes it attractive for a merchant to sell on their platform. Success of the merchant is in turn a measure of success of GLBE
2. GLBE also makes it extremely easy for shoppers to buy (Pink square shape on right) across boundaries with all the facilities it has to offer (see figure 1, pink nodes in capital letters as well as figure 2 below, this is from their F-1 filing)

Figure 2: From Global-E F1 filing with SEC Sept 2021

MOST IMPORTANTLY, 

Two Key observations are revealed in the network figure (this is why I love this type of modeling, it allows to read between the lines).

  • Observation #1: Offloading complexities occupies a central role in the workings of this set up. This is the central tenet of Global-E's workings and this is the lynch pin around which their success rests. And they are doing a great job at it. 
  • Observation #2: The interface between merchant and shopper is right at the payments, pricing and duties/taxes nodes. The alignment of this interface (payments, pricing, duties/taxes), is the crucial solution of cross border commerce. This is the under pinning platform for the 'off loading of complexities' central node.

This is a fantastic network model, that the computational network algorithm has generated. This is purely based on textual and conceptual information in the filing. I am amazed at the sheer simplicity and extreme robustness of the the model which reflects the values of the company. I am pleased I am invested in the company and would not mind adding more soon!

Disclaimer: I own shares of GLBE. Data obtained from F1 filing, SEC and public sources.

Mercadolibre (MELI), a digital footprint more than just Latin America (LATAM)

I was wondering about the reach of some of the continent specific e-commerce platforms. For example, Mercado Libre (ticker: MELI) in Latin America, and Sea limited (ticker: SE) in Asia and their effect on cross border commerce. I did a tree map on Global-E few days ago (Included at the end of the article as supplemental material) which show cases it strengths, on how it is making cross border commerce easy. Mercado Libre is huge in South America. It also has national websites catering to specific countries such as mercadolibre.com.pe for Peru and mercadolibre.com.ni for Nicaragua. It has done an excellent job of 'personalizing' the websites to the countries they cater.

One way to look at extent and reach of a website is to look at server traffic and countries of origination to those sites. I obtained data from Cloudflare to see where the visitors to Mercado Libre are coming from. This gives a good indication of the visitors to the site and a proxy of its reach. 

Method: I obtained the domains for Mercado Libre and its country specific website links. Then using this information obtained the website statistics from Cloudflare.  Cloudflare is a web infrastructure and website security company that provides content delivery network and DDoS mitigation services. The data was limited to last 30 days and provided top 10 locations for visitors to the respective sites. I then cross tabulated data for all of the country specific domains to see where are people visiting from on Mercado Libre's website. Given this was a multivariable data, it is represented as network map which shows the connections in entirety. The figure is shown below.

Figure 1: Country of origin of visitors to Mercado Libre's websites

Results

  1. Blue nodes are country specific websites for Mercado Libre, the key for the countries are Argentina (.ar), Bolivia (.bo), Brasil (.br), Chile (.ch), Colombia (.co), Costa Rica (.cr), Dominicana (.do), Ecuador (.ec), Guatemala (.gt), Honduras (.hn), México (.mx), Nicaragua (.ni), Panamá (pa), Paraguay (py), Perú (.pe), Salvador(.sv),Uruguay (.uy) and Venezuela (.ve) (arrow #1)
  2. The location country of the visitors are nodes colored with gradient green to red and sized. Thus the visitors from the country with highest frequency will be represented by largest nodes that are green while those that are not as frquent will by small and red. For example, in the figure Brazil, Argentina and United States are the largest nodes (most visitors, see dotted shape arrow #2) while Japan and HK (e.g. #3 arrow ) are smallest.
  3. The distance of the node to the domains is based on the frequency of visitors, thus if the nodes are closer to the country node, it means that the visitors from that country were most frequent. For example the Chile node is closest to .cl since most visitors to .cl were from Chile (see arrow #4)

Discussion

Following are my personal observations

  1. That most visitors to Mercado Libre's websites are from Brazil and Argentina and respective LATAM countries is expected, what was not expected there was also considerable website traffic from United States,  Europe (Netherlands, France, UK). This tells me that the MELI footprint extends far beyond LATAM and that visitors to the site are coming from outside of South America as well.
  2. There were some interesting findings as well, there we significantly higher number of visitors from Netherlands and France to Mercado Libres Nicaragua, Honduras and Salvador websites.
  3. There were also visitors from Asian countries like Japan, South Korea, Hong Kong albeit is much lower frequency.

This analysis shows that the visitors to Mercado Libre are more than LATAM countries and the digital foot print extends to US, UK, Europe and even Asia. The analysis has some limitation though for example, the look back period is only 30 days, there could be other patterns is the look back period was extended further. Cloudflare's data only allows for a 7 or 30 day look back. The data is limited to only top 10 countries. Visitors from a country may not mean customers, we do not know the intention or the deliberation of the visitors. While it is possible that some one may accidentally end up on their website, the proportion of those would be fairly small.  Additionally, with the advent of usage of VPN services, the origin of visitors could be spoofed but again this may be expected to be a minuscule proportion and no way to get around this. 

Conclusions: Mercado Libre, Inc. is an Argentine company headquartered in Buenos Aires,  that operates online marketplaces dedicated to e-commerce and online auctions, including mercadolibre.com.  The company operates in South America and has has operations in Argentina, Bolivia, Brazil, Chile, Colombia, Costa Rica, Dominican Republic, Mexico, Spain, Ecuador, Guatemala, Honduras, Peru, Panama, Uruguay, and Venezuela. Thought its operations are seemigly limited to South America, its digital foot print extends well beyond its borders.

Disclaimer: I own shares of Mercado Libre (MELI) and am invested in the company. The data was obtained from public sources.

Addendum:

Figure 2. Global-E, GLBE a cross boundary commerce platform


Saturday, September 18, 2021

Lemonade (LMND), a semantic analysis of earnings: time to buy?

or Why I am not investing in Lemonade - LMND (...yet)

Early in August Lemonade insurance company announced their earning and quarterly updates. The stock did not farewell, creating a potential buy opportunity. This was also discussed quite a bit on the various internet fora and there were many proponents of the stock as well as those who felt that perhaps it was not the right time. This piqued my interest in LMND since it is a finance-tech (fintech) insurance company. Lemonade Inc. offers a number of products including renters' insurance, homeowners' insurance, pet insurance and term life insurance in the United States. They also operate in limited areas of Europe such as Germany, the Netherlands, and France. They have a predominantly young demographic (approx 65-70%) and catchy ads to target to their target population. 

This encouraged me to dig deeper in to their earnings, operations and fundamentals with 'semantic network analysis'. You may perhaps know from my other articles on the site, I believe this method is unique in that it allows to seek hidden patterns or those connections that are not immediately revealed. 

The rationale for doing something like this is that ALL text has a linear structure (which is top-down, left to right etc) which  is the most common way of conveying information. However, in this linear flow, certain connections can be missed. Unsupervised Concept network analysis takes concepts in the text and breaks them into parts, which are then connected by common linkages. It is process intensive but is highly informational. This nonlinear text visualization of concept linkages allows for hidden patterns to be revealed, read between lines. 

With that brief intro, let me walk you through the process of my analysis of Lemonade's reports. The earnings came out on August 4th, 2021, right after this came out, I generated my unsupervised semantic network to analyze if it was a good opportunity to invest in LMND. This network model is shows in figure 1.

Figure 1: An unsupervised semantic text network analysis of Lemonade Co. earnings
Each node above, represents a tangible concept and entity and it is linked by edges (lines) which connect the related nodes.

  • Light blue nodes: pertain to discussion on Lemonade car, their car insurance product
  • Green nodes: pertain to their financial situation and their arrangement with reinsurance markets
  • Yellow nodes: are their existing products (home, pet etc)
  • Pink nodes: pertain to their progress and expansion plans
  • Purple nodes: pertain to their ESG efforts

Then using a computational algorithm (force-directed layout) to space them out, linked nodes are pulled closer while those that are not related are pushed apart. This is how patterns and connections emerge (figure 1).

FOUR broad themes emerge

1) Reinsurance drag: The is a big factor weighing down the business and that is the their necessary partnership with reinsurance industry. They are contracted to cede 75% of the premium they obtain from customers that obtain insurance through Lemonade. This is going to be a big drag until 2023, when they will renegotiate the terms of this contract. They are showing some improvement in reducing this percentage but it will continue to be a drag. Also there is 'new business penalty' which means as they expand into new lines of business, this penalty will tack on and eat into their profit margin. This was huge flag for me. A turnaround for me would be to see this at much lower percentage (ideally zero) to renegotiate after 2023 and see what terms are offered. Moreover, the location of this cluster of nodes right between Lemonade car (light blue) cluster and other products (yellow nodes), tell me of the profound impact this has on their operations.

2) Verticals need better performance and integration: Their products are mature and work HOWEVER, the performance across the board is lumpy. Some products (yellow nodes in graph) are floundering like life and renters while others are doing better (pet). A turnaround factor for me if, in next few quarters, we see company firing on all cylinders for ALL of their products.

3) Lemonade car still has to go live: there are significant goals that need to be met before their car insurance product is ready. It is revolutionary no doubt - where car insurance is going to based of telematics data and AI etc. So far they do not have regulatory approvals and did not provide launch dates. A turn around for me on this would be is a) they get regulatory approvals and b) they launch it.

4) The ESG nodes and the expansion nodes are sparse: This part of the network graph was anemic, at least as far as their discussion goes. I would like to see a much more robust patterning here.

The stock has fallen another 10-12% since and as of today the chart looks like this (figure 2, below)

Figure 2: Technical set up for traders (image courtesy: Stockcharts.com)
 

A technical view of the stock shows a divergence between stock price and RSI as well as MACD (image from www.stockcharts.com) which may suggest they a small price improvement is possible. This may be okay for stock traders who want to try and scalp some profits. However, the underlying fundamental story has not changed for me and so as a long term investor, I have NOT entered into a long position yet.

Conclusion: Based on my semantic analysis I decided to not invest in Lemonade and wait till there are improvements in certain key issues.

Friday, September 17, 2021

Zoom Video Q2 2022 post earnings breakdown, a semantic network analysis

Zoom Video: With it being down 18% in my portfolio it is time to question my beliefs and decide whether to add, hold, pare or get out. The following post is a step-by-step walk through of my process, reasons and conclusions. Brace yourself, its a long one. TLDR at bottom. 

Lets begin,

On Zoom developments:

Figure 1: Zoom Apps discussion

Zoom apps section of Zoom has nicely thought out plan with an internal and external work force (Start ups, zoom apps fund). I think this will continue to crank out developments given its set up. The network model is shown in the figure (Fig. 1). CEO called this "internal innovation engine".

Figure 2: Zoom events discussion

Zoom events is presented as a step above webinars and meeting with its USP being a solution for mass reach to host and produce events. This is not experimental, but a fully functioning product which the company has tested on its own event 'Zoomtopia'. See figure 2 above.


Figure 3: Zoom 'wins' this quarter

In the sales (Figure 3), they made some good sales with both new large customers as well as up-sells to prior customer. Main emergent theme, I got was 'Zoom phone' is being offered as 'Chef's special' and is likely being pushed hard. If this is the case, then zoom phone numbers will improve QoQ and people will start seeing traction in addition to zoom meetings. More interestingly is the partnership with Telkomsel which is Indonesia's largest cellular/internet Telecommunications provider.

Figure 4: Zoom has identified a clear need that enterprises have

The CEO has nicely outlined what they see as their target audience. It is the offices, organizations they are going after and filling the enterprise need for a digital platform that does communication (Figure 4)

Chief Finance Officer's section

1. Enterprise customers spending more than $1 million in ARR up by 77% year over year
2. A lot of Zoom phone numbers - see the comment above on pushing this product.
    - number of customers spending more than $100,000 in ARR on Zoom Phone by 241% year over year.
    - 2 MM Zoom Phone seats, eight months after reaching first million.
    - Eight Zoom Phone customers with more than 10,000 seats in the first half of FY '22, to a total of 26.
    - largest Zoom Phone deal to date twice in the same day.

Cautionary comment (I): customers return to more thoughtful, measured buying patterns. While revenue, profitability, and cash flow were strong in the second quarter and the first half, other metrics have begun to normalize, especially when compared to the unprecedented year-over-year comps.

3. total revenue grew 54% year over year to $1.02 billion,
4. Strength in direct and channel businesses, which grew at twice the rate of online business.
5. Zoom Phone, Zoom Rooms, and Asia PAC growth also accelerated in the quarter
6. healthy mix between new (74%) and existing customers (26%) of incremental revenue.
7. Approximately 504,900 customers >10 employees, up 36% year over year and representing 64% of revenue.
8. Net dollar expansion rate for above group exceeded 130% for the 13th consecutive quarter as existing customers increased their spend
9. customers < 10 employees down to 36% of revenue (from 38% highest)

Cautionary comments (II): Small and medium sized businesses and consumers < 10 employees are expected to continue to decline as a percentage of revenue.

10. Regional news: Americas revenue grew 50% year over year. Combined APAC and EMEA revenue grew 62% year over year to be approximately 33% of revenue, up from 31% a year ago. significant investments in Asia Pacific, our direct sales team drove several strong wins in the enterprise segment (See NEC).'

Cautionary comment (III)
: headwinds in EMEA (Europe, ME and Africa) declines in the online segment.

On Their Spend :

1. Research and development expense grew by 89% year over year – needed for innovation. At present 5% of rev target is 8% (See below section)
2. Sales and marketing expense grew by 72% year over year to $211 million - plan to increase investment in global sales capacity, as well as digital marketing and events,
3. G&A expense in the quarter grew by 73% to scale and invest in systems, automation, and compliance to meet our new scale.
4. Remaining performance obligation (RPO) totaled approximately $2.3 billion, (up 66%) of which 69% will be collected over 12 months. Q1 represents largest renewal quarter.

Cautionary comments(IV): Zoom expects that front-weighted seasonality will persist and potentially become even more pronounced given the scale of user base. They expect total deferred revenue and RPO to be modestly down from Q2 to Q3. RPO serves as a proxy for future revenue, the RPO growth rate provides a leading indicator of growth but Zoom indicates that may not be the best measure to gauge one aspect of their growth.

My take

The market has reacted appropriately to the cautionary comments provided with gap down in the price of ZM stock after earnings. However, I believe this setback is transient and the business will get over the headwinds and declines noted. Based on the goal identified by CEO, they are going to target enterprises hence, they may not be planning to target the small <10 employees companies anyways. RPO is expected to be down from Q2 to Q3, due to seasonality..look at this as not QoQ but a Year over years comparison. 

Q and A highlights

"headwinds in the online segment (zoom meetings) of our business but continued strength in the upmarket enterprise in both Meetings and Phone."

General: The tone and sentiment of the earnings call was mixed which was aptly correspond with the drop in share price after the earnings conference. That being said lets dig in, I personally do not want to focus exclusively on online segment to decide Zoom's worth. The reduction in usage here, is expected, people are not "zooming" as much since they are going out and doing things in person. Also, individual users, smaller users are sort of the 'side shuffle'. This reduction in online segment is also what management thinks is the headwind for the Europe, middle east and Africa. 

The CEO has made it clear that zoom is targeting the enterprise segment which is doing very well. Areas of growth are Zoom phone (presently adding about 500K seats every Quarter), Zoom corporate licenses and Zoom Rooms all which are showing good numbers in growth. 

Zoom online had a different motivation when people jumped in on it, it was "desperation", but now with vaccine and better understanding of the situation, people can be deliberate in their purchases. The latter is whats happening to Zoom Phone, the fact that it is showing improvement, is telling  me, that the decision to increase corporate licenses and buying more seats on phone are deliberate decisions and not desperate actions. Deliberate actions provide a stable revenue, as opposed to volatility of desperate actions.

On Five9 acquisition: Current users (including enterprise customers) per zoom want to migrate from on-premise to the cloud. Having an integrated phone and contact center solution (Zoom + Five9) would be attractive to companies. This would be new revenue stream and grow Zoom business. Based on this assessment, CEO believes it is appropriate to double down on the cloud as the contact center of those.

On monetization of free users: Schools through K-12 will not be monetized. Kudos on firm moral compass and karmic gains on goodwill. Also, this is a long term investment, kids who use and are familiar with zoom tech are going to be adults who will use zoom tech. bravo! I also like the fact, they the leadership is acutely aware of where and when to monetize, for example, they felt that further monetization of online users (mom and pop store, smaller companies individual users) may not be the sustainable strategy. Hybrid adoption in EMEA is lagging APAC which is lagging US (my impression) when these pick up, these will be stimulants for higher growth.

On vision to sustain growth:
"Yesterday":    Zoom videoconferencing
"Today":         Zoom Videoconferencing PLUS Zoom Phone
"Tomorrow":     Zoom Videoconferencing PLUS Zoom phone PLUS Zoom platform/Full suite

On predicting user trajectory: One analyst asked when the zoom online (smaller users) will trough out and growth of enterprise segment will dictate the discussion. This was an unfair question since boom in online users was pandemic driven, and attempting to answer this question is akin to predicting future course of pandemic.

On relationship of zoom phone and zoom meeting numbers: Analyst at Piper-Sandler asked a good question IMO. They wanted to know if zoom phone is leading to a greater number of seats at existing customer. The CEO's answer was not as clear on this one. It may seem that one year ago, Zoom did not expect it would up sell phones to existing base in amount that it did. They were anticipating new customers to bundle video and voice through phone. But it seems that more customers are going to deploy video first and then deploy Phone.

On competition from other services: Future work will be hybrid work and mainstream. Embracing hybrid work by employees, students, WFH, will require a solution. Per Zoom, a 'good enough' solution will not do well (which Zoom claims are other services). Zoom claims it is best-of-breed with better IT support and productivity tools  (which others do not have same level of). 

On expenses: Zoom was not able to hire and invest in proportion to revenue growth. They are under-invested in our R&D (5%), with goal of 8%. Continue to spend on marketing.  G&A is in range of where it needs to be. Cost of good sold (COGS) will reduce as services move from public cloud to Zoom data centers. As K-12 schools go back to campuses, expect to see  improvement in our gross margins.

On Zoom events: This was a redesign of OnZoom to meet the demand of enterprises for corporate events. Consumers (like online fitness or cooking class) are expected to catch on.

Approximately a 1/3 of the analysts were focused on the online meetings, and small users segment which may have given an overall disappointing tone to the discussion. There are however quite promising pieces of information which are reassuring.

Verdict: I will hold on to my Zoom shares, as of time of this note they were down ~18%, if they drop more, I will add to lower the cost basis and to keep the draw down around 20%.

Sunday, September 12, 2021

Fastly (FSLY) versus Cloudflare (NET): Which stock is better on cash flow (operations) metric?

As noted before, I like to look at cash flow from operations, since it is one metric that tells me how good is a company at generating cash/revenue from its day to day operations. This money can be reinvested into the company for organic growth, acquisitions, research etc. Other mechanisms to raise cash are from investing activities and from financial endeavors. This has been nicely outlined in the article I did on Palantir, and would recommend giving it a read, if not already done so

I own Cloudflare (NET) stock but Fastly (FSLY) is a competition that has recently lost much of it value and is down considerably. In fact, at the time of this note, FSLY was down 40% and NET was up 280%, over a span of 1 year.  In order to see if the market had mispriced FSLY and if it could be considered a buy, I analyzed the CFO metric between the 2 companies. Perhaps, this will be a clue, to answer why one company has tanked while other has done so well. Moreover, it will allow us to examine if there may be opportunities to buy either of the companies. This is shown in figure below.

Figure 1: Comparison of Cloudflare and Fastly, operational cash flow, stock price and expenses

On balance cash flow from operations compared to stock price at time of earnings for NET (panel A, top left) compared to FSLY (Panel D, bottom left). The stock price shows overall congruence for both stocks. 

Cloudflare: Next, I would like you to focus on the earnings report quarter ending 12/31/2020, look at the on balance net cash from operations compared to reported sales and marketing expense (panel B), and reported research and development expense (panel C). There was a drop in the cash flow from operations (solid blue arrow)  which piqued my interest and then I want to see why – as you can see this drop actually corresponds to a rise in expense for S&M and R&D. So this likely is not reduction in cash flow from problems in company operations but likely allocation of cash to good use. Hence this drop is “reassuring”. The market likely responded to this report in a positive manner and hence the price went up (hollow blue arrow – panel A).  This is shown below which is the same figure as 1 but panels are expanded for detail (below)

Figure 2: Cloudflare
Fastly: Now in contrast, lets focus on the earnings report quarter ending 3/31/2021 for FSLY (bottom row), look at the on balance net cash from operations compared to reported sales and marketing expense (panel E), and reported research and development expense (panel F). There was a drop in the cash flow from operations (solid red arrow)  which piqued my interest as well and then again I want to see why – as you can see this drop actually does NOT correspond to a rise in expense for S&M (you can see that S&M expense 'gold diamond shape' is actually flat) and R&D there was an increase in spend but not commensurate with the drop in operational cash flow. I take this reduction in cash flow as problematic, a possible reflection of issues with company operations and this drop is “concerning”.  This was the opportunity to get out, sell the stock (red hollow arrow). This is shown below which is the same figure as 1 but panels are expanded for detail (below)

Figure 3: Fastly

In conclusion, NET has a stronger cash flow sheet and this is reflection of excellent operations, high efficiency and robust execution. If FSLY is able to improve on the on balance cash flow over the next few quarters, then I would be a potential buy opportunity but for now, Cloudflare looks more attractive. Hopefully, this helps readers to assess companies for themselves. If you have any comments or would like help refine this method, please message me on twitter (handle in figure).

Disclaimer: I own shares of Cloudflare (NET). The analysis if for my personal understanding of companies I invest in, but am sharing it for other in case, someone else finds it useful. This is not investing advice. All data were obtained from public sources.


Saturday, September 11, 2021

Palantir: Operating profitability and expense trends (Its Saul Goodman)

One of my go to metrics to look at how well a company is operating, is to look as cash flow generated from operations. When a company executes well, the cash flow from operations increases and the 'On balance cash flow from operations' (OBCFO) will increase from quarter to quarter. When this metric increases  quarter over quarter, or year or year, or quarter over quarter last year, these are positive signs of increase in operational cash. The reason, I really like cash flow from operations, is that this is a measure of recurring revenue which is inherent to the day to day functions of the company. The other cash flows are cash flow from investing activities (these include purchases of physical assets, securities, or the sale of securities or assets) and cash flow from financial activities (activities involving debt, equity, and dividends). These latter 2 cash flows are indicators of investment savvy and financial gymnastics of a company and no so much a reflection of how the company operates. The cash generated from operations can be reinvested into the company for growth in term of new tech, acquisitions, product development etc. With that brief introduction, lets look at Palantir and its cash flow for the past 8 quarters.

Cash Flow from operations compared to Stock price.


Figure 1: On balance cash flow from operations compared to stock price for Palantir

It took me a while to change my mindset, that a stock price is not the company and a company cannot be evaluated on basis of stock price alone. A stock price is a marker of the sentiment of what the majority thinks the company is valued. In any case, let compare the OBCFO to price of Palantir's stock. This is shown in figure 1. The price, is the closing price on the week, the results of earnings came out.

One of the immediate things to notice is that the OBCFO has increased over the last quarters and it shows a healthy uptrend. Another important feature in this figure, is what I call “fundamental bullish divergence” (green arrow), this happens when the stock price is trading lower and the OBCFO is actually higher, this usually, a strong clue for me to add to shares or enter a new position (provided I believe in the leadership and company management). This event happened after the March 2021 earnings, where the price was trending lower than its recent high.

Cash Flow from operations compared to reported sales and marketing expense.


Figure 2: On balance cash flow from operations versus Sales and Marketing expense for Palantir

This however is only part of the equation, if for some reason the cash flow is not increasing, like it did in quarters ending 6/30/2020 to 12/31/2020, then we absolutely must look for reasons why. One place which may explain why cash flow from operations was low, is if the company used some of that cash to either grow the operations (either by increasing sales and marketing) or by focusing on research and development. This is shown in Figure 2, as on balance cash flow from operations is falling (blue line) from periods 6/30/2020 to 12/31/2020, the reported sales and marketing expense is rising. So this fall in cash flow was a “good thing” (grey shape - dotted line)

Cash Flow from operations compared to reported Research and development expense.

Figure 3: On balance cash flow from operations compared to Research and development expense for Palantir

I also make it a point to look at R&D expense, after all, if a company is to grow, it needs to continue to innovate and apply those discoveries to further its mission. This is shown in Figure 3, as on balance cash flow from operations is falling (blue line) from periods 6/30/2020 to 12/31/2020, the reported expense for research and development is rising. So this fall in cash flow was a “good thing” (grey shape - dotted line)

 Palantir, in this case has executed flawlessly for the past few quarters and its all good man (In case you did not get the humor reference in title) and this give me good confidence that the company will continue to grow and as consequence of this, the stock will also continue to grow.

 Disclaimer: I am long term investor and own shares of Palantir. The data were obtained from public sources.

Thursday, September 9, 2021

ZoomInfo (ZI) a history of opportune acquisitions

 Today, I wish to provide a little more color on one of my bigger positions ZoomInfo. ZI is US subscription-based software as a service (SaaS) company that sells access to its database of information about business people and companies to sales, marketing and recruiting professionals. Their tag line is simple

ZoomInfo is a leading go-to-market intelligence platform for sales and marketing teams.

Some Facts about ZI which made me invest in it: it has shows a 48% revenue growth over 3 years, 54% revenue growth (TTM vs prior TTM), gross profit margin 87%. Midcap at 24B. Its EPS growth was 50% and has a 97% institutional ownership. It is also part of my 'Hot watch list stocks' which is release every week on Twitter (see image for handle). These are the stocks that are potentially excellent picks long term and doing well in regards revenue and cash flows.  

I am of the firm opinion, that a business that generates positive and increasing operating cash flow is one which has the most opportunities to grow under able leadership. ZoomInfo checks all of those qualities hence is part of my portfolio. 

The stock has done well since I acquired it, and I anticipate it will continue to do well in future. The reason for this is the leadership at ZoomInfo has demonstrated acumen for acquiring companies that add to its value and provide a tremendous growth spurt. They are also exceptionally adept at making the right partnerships to further their business. That being said, here is a timeline chart of ZoomInfo acquisitions. On a side note, DiscoverOrg merged with ZoomInfo to be the company it is today, 2 of the acquisitions early on are this DiscoverOrg/ZI mash but that should not change our assessment of the company.


ZoomInfo: A timeline of acquisitions (blank) and partnerships (orange)

In order to further understand how these acquisitions added to the growth of the company, I have summarize this information in the table below (* represents partnerships).


Who

When acquired

Why was it acquired?

How (did it help?)

iProfile

2015

pioneer of sales intelligence for the technology industry

Combine iProfile’s comprehensive global professional contact and sales intelligence database with DiscoverOrg’s proprietary sales intelligence and analytics

Rainking

2018

delivering the most accurate intelligence that sales and marketing teams use

Solidify company’s position as the world’s leading B2B sales and marketing data provider, to accelerate pipeline and revenue growth

Y Labs

2018


To expand its center for product development and security operations.

Datanyze

2018

world-wide leader in technographic data: uses machine learning and proprietary methodologies to capture the technologies

be able to supplement its company and contact information with real-time alerts that enable sales and marketing professionals to sell based on customer technology decisions.

NeverBounce

2019

a leading provider of email verification and list cleansing services

enhanced accuracy of in-platform emails, seamlessly verify all email data in their internal marketing and sales systems

Komiko

2019

Komiko’s AI-powered CRM automation, playbooks, and predictive analytics

to accelerate the sales pipeline with valuable analytics,

Clickagy

2020

a leading provider of artificial intelligence-powered buyer intent data

Streaming Intent, an innovative solution that identifies companies with above-average search volume on business-to-business (B2B) topics within minutes of their web activity

Everstring

2020

a leading artificial intelligence-powered, business-to-business (B2B) data solutions provider.

EverString gives ZoomInfo a comprehensive business data graph, providing the foundation needed for enterprises to identify their total universe of customers and prospects, define their ideal profiles, leverage granular keywords and attributes to predict success, and focus their go-to-market motions.

BeyondCodes*

2021

a leading B2B demand generation company serving customers in India and globally.

partnership provides companies in India, as well as other countries in Asia, with direct and unprecedented access to ZoomInfo’s leading sales intelligence platform.

Leadspace*

2021

business-to-business (B2B) customer data platform provider,

partnership gives sales and marketing teams an unprecedented combination of B2B intelligence with enterprise-level data management and activation tools. Customers of Leadspace can now get access – via new connectors – to ZoomInfo’s leading B2B intelligence, so they can go to market more efficiently and effectively.

Snowflake*

2021

the Data Cloud company

Snowflake Data Marketplace to centralize and streamline data delivery. Customers can now use Snowflake’s platform to integrate ZoomInfo’s industry-leading company and business contact data into their technology stacks—with no additional integration or extract transform load required—and generate insights at scale.

Insent

2021

a powerful conversational marketing platform that identifies website visitors in real time, uses artificial intelligence (A.I.) and advanced lead routing rules

Initiate real-time conversations, and increases conversions

Lean Data*

2021

a leader in lead-to-account matching and routing

delivers a seamless, elegant product experience for their joint customers. provides customers with the ability to deliver leads to the right sales representatives with greater accuracy and speed, driving revenue growth.

ChorusAI

2021

a leader in Conversation Intelligence

Enable Insight-Driven Targeting, Coaching, and Decision-Making for Go-to-Market Teams

Ringlead

2021

an industry leader in data orchestration and revenue operations automation

Enable companies to streamline and execute data-driven go-to-market motions at scale based on high-quality, actionable data.

Thus every single partnership or acquisition ZoomInfo management has made, has been synergistic to the business and has propelled growth.

Disclaimer: All the information has been collected from public sources.  I own shares of ZoomInfo.

Popular Posts