Introduction
The five stocks that make up the FAANG-M are facebook/Meta (FB), Amazon (AMZN), Apple (AAPL), Netflix (NFLX), Alphabet (GOOG) and Microsoft (MSFT).
As of the time of writing this note, the SP500 is heavily tilted to these mega caps. Apple Inc makes up 5.90% of the SP500 index, Microsoft Corp (5.60%), Amazon.com Inc (4.05%), Facebook Inc A (2.29%), Alphabet Inc/Google is 3.98% (between A and C class shares)
Thus stock price changes in these companies can have a significant impact on the price of general market indexes.
The price chart of the tickers in question is shown below (charts courtesy bigcharts.com). If you are familiar with the background you can skip the next few sections and go straight to the tabulated results.
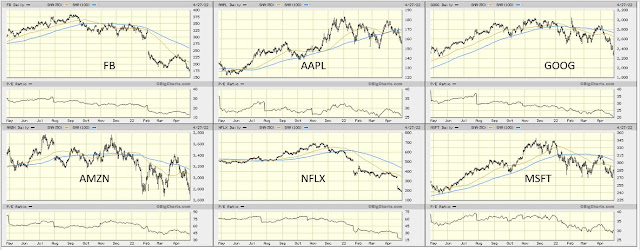 |
| 1 YEAR STOCK PRICE |
Background
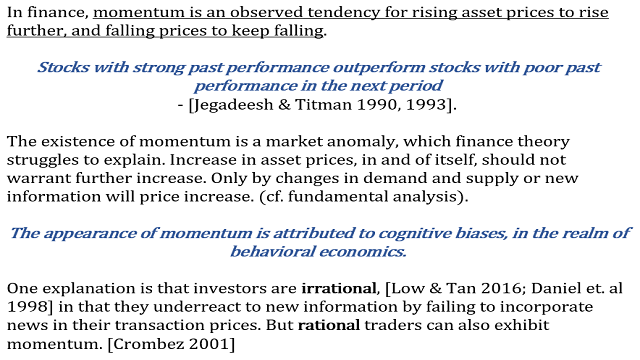
Price momentum is an observed tendency for a rising price of an asset to keep rising, and a falling price to keep falling.
Thus stocks with strong performance tend to continue outperforming for the next set period. The period is important since a stock that is ripping today may not do so in 5 years. The effect of momentum is is best seen in the short and mid-term time frames.
A little background on this concept is pinned as a tweet in my profile.
Using a composite score derived from momentum indicators, I have set up rules based entry and exit signals. These allow me to buy and sell without much emotional wrangling. If the rule is met - buy, if the rule holds - hold and if the rule is broken - sell.
Vector direction and strength:
Just as a vector (in physics) has direction and strength, the price movement has direction and strength.
Based on the 4 medium term indicators for direction of the price movement (bullish versus bearish) and 1 indicator for the strength of the price movement, I am able to break down price action of any stock to one of 5 grades or scores.
Score 0: Highly bearish
Score 1: Bearish
Score 2: Neither bullish nor bearish
Score 3: Bullish
Score 4: Strongly bullish
Score of 0 and 4 have the added caveat of watching for reversals as with any extreme price movements. With this basic information lets analyze the momentum for the 6 stocks in question
The Indicators:
As a gauge of direction (bullish or bearish), I am using a 60 day period RSI (relative strength Index), MACD (Moving averages convergence divergence), MFI (Money flow index) and Rate of change (ROC). As a gauge of strength I am using a 14 day ADX (average directional index) but, I do not incorporate it in the calculation of the score. The ADX is only to inform if there is going to be strong up or down movement possible or if the price is going to slowly trend sideways
RSI and ROC are pure price momentum indicators, one is range bound (0-100) and other is not. MFI is a price and volume momentum indicator which is also range bound. MACD is both leading and lagging indicator based on price. Thus, it is expected that the 4 indicators would provide a different input and it is important that they NOT have a correlation of 1.
Application of rules
When the momentum score is 0 of 1, it not an ideal time to add or initiate a position. When the score improves to 2, the ticker could be on a watch list and a good entry point is when score improves to 3 or 4. As long as the price stays 3 or 4, one could hold the position When the price momentum slows to bearish and falls to 1 or 0, sell signal comes on.
Results

Thus as of today, none of the megacaps are showing a buy signal. Amazon is on watch and faring better than the rest.


