Monday, May 23, 2022

Week 20: Momentum Analytics Portfolio update. Week ending May 20, 2022

The portfolio and indexes weekly return

The momentum portfolio outperformed the indexes this week too (but not in a good way*). The following is the weekly total returns for the portfolio compared to the index. As you can see my momentum portfolio lost money but much less than the broad market, So in one way the portfolio did outperform the indices. This is a very good sign, IMO since if the draw downs are less when the markets tank, it think the portfolio has done good job of risk mitigation. 


I am using Morningstar US market index as a benchmark. Thus the portfolio outperformed the market and beat it this week. 

Total Return: measures the theoretical performance of your holdings for a specified period of time, taking into account the beginning and end values of your investments as well as dividends.

Personal Return calculates the investor's returns, taking into account an additional factor in its calculation: the capital that you added or withdrew from your fund or portfolio throughout the specified period of time. The calculation of Personal Return illustrates how your allocation of capital has affected the performance of your portfolio. 

One of the things I have taken away from the last few months of tech/Nasdaq debacle is that there needs to be a risk system in addition to a reward system. The momentum portfolio automatically kicks in the risk mitigation when bullish momentum for stock is worsening and thus capping losses. 

This system worked beautifully well and this draw downs were capped in particularly volatile week.

Positions, Position Sizes and Momentum Updates

The only position that is still in green in AT&T (T), others are in red at the moment. 

Score classification

  • Score 0: Super bearish, no entry
  • Score 1: bearish, no entry
  • Score 2: Hold
  • Score 3: bullish, entry or hold
  • Score 4: bullish, entry or hold.

As it turns out the momentum scores can also assist with position sizing, with those that have the most favorable scores-setups have more additions to the positions making those portfolio positions heavier. 

Thanks for reading! Next post will be end of week 21, on or about May 28, 2022. Until then keep tracking the momentum!

Saturday, May 14, 2022

Week 19: Momentum Analytics Portfolio update. Week ending May 13, 2022

The portfolio and indexes weekly return

The momentum portfolio did as intended this week too. The following is the weekly total returns for the portfolio compared to the index. 


I am using Morningstar US market index as a benchmark. Thus the portfolio did better than the market and beat it this week.
 

Total Return: measures the theoretical performance of your holdings for a specified period of time, taking into account the beginning and end values of your investments as well as dividends.

Personal Return calculates the investor's returns, taking into account an additional factor in its calculation: the capital that you added or withdrew from your fund or portfolio throughout the specified period of time. The calculation of Personal Return illustrates how your allocation of capital has affected the performance of your portfolio. 

One of the things I have taken away from the last few months of tech/Nasdaq debacle is that there needs to be a risk system in addition to a reward system. The momentum portfolio automatically kicks in the risk mitigation when bullish momentum for stock is worsening and thus capping losses. At the same time, if the momentum turns bullish, one can continue to reap reward as long as the underlying market trends support the accumulation of the stock.

Positions and Position Sizes

Positions and sizes

Composition of portfolio

As you can see in the table below, the portfolio is heavily tilted towards consumer defensive and Industrials compared to the SP500. Thus the portfolio is adapting to the prevailing trends in the stock market by weeding out those that are not in favor (technology, financials). I do not invest in health care stocks so it will always be 0 and I think that the energy sector is a little overextended so I have not invested in it these past weeks.


Score classification

  • Score 0: Super bearish, no entry
  • Score 1: bearish, no entry
  • Score 2: Hold
  • Score 3: bullish, entry or hold
  • Score 4: bullish, entry or hold.

Momentum updates of stocks in portfolio 

Stocks and their momentum scores at end of the week.

As it turns out the momentum scores can also assist with position sizing, with those that have the most favorable scores-setups have more additions to the positions making those portfolio positions heavier. 

I fixed the issue with the 4th indicator which was giving me some whipsawing - after using MFI derivative, ADX derivative, RRG momentum derivative, I think I have found one to help with clearer signals - Aroon derivative. This is important since I want the indicators to overlap but not have a correlation of 1. Aroon derivative is unique as it is in effect "time over price signal" as opposed to "price signal over time".

Thanks for reading! Next post will be end of week 20, on or about May 21, 2022. Until then keep tracking the momentum!

Saturday, May 7, 2022

Week 18: Momentum Analytics Portfolio update. Week ending May 6, 2022

The portfolio and indexes weekly return

The momentum portfolio did as intended this week. The following is the weekly total returns for the portfolio compared to the indexes 

  • Dow Jones 30 (DIA) was -0.50%
  • Morningstar US market index -0.57%
  • Momentum Analytics Portfolio: -0.72%
  • SP500 Index (SPY) was -0.76%
  • Total US market for the week (VTI) was -1.19%
  • Nasdaq100 (QQQ) was -2.90%
Thus the portfolio did better than SP500 and total market (US) but Dow30 index did better this week than all other benchmarks

Results by month since start of momentum investing

Here are the monthly results (to date) of the portfolio compared to Morningstar Total US Market index as benchmark

Month             total return                personal return             index return 

Mar                 3.72%                         2.68%                             3.67%

Apr                 0.55%                         -1.85%                            -9.09%

May (to date)    -0.72%                       -0.75%                            -0.57%

I use Morningstar to track my portfolio returns. According to Morningstar,

Total Return Total Return measures the theoretical performance of your holdings for a specified period of time, taking into account the beginning and end values of your investments as well as dividends. 

Personal Return Personal Return calculates the investor's returns, taking into account an additional factor in its calculation: the capital that you added or withdrew from your fund or portfolio throughout the specified period of time. The calculation of Personal Return illustrates how your allocation of capital has affected the performance of your portfolio. 

As seen in the returns comparison, the momentum portfolio has done well compared to the total US market index.

Momentum Portfolio return (Bold green line), Morningstar US Market Index (Light Grey). Courtesy Morningstar.com

 Positions and Positions sizes

Positions and their proportion

Buys/Adds this week

HON - Honeywell
TGT - Target
AIG - American International group
CAT - Caterpillar
GD - General Dynamics Corp.
LMT - Lockheed Martin
MMM - 3M Co.
DOW - Dow Chemicals
MA -  Mastercard
DUK - Duke Energy
IBM - International Business Machines


Sells this week

RTX - Raytheon
PG - Proctor and Gamble


Score classification

  • Score 0: Super bearish, no entry
  • Score 1: bearish, no entry
  • Score 2: Hold
  • Score 3: bullish, entry or hold
  • Score 4: bullish, entry or hold.


Momentum Updates of the Stocks in Portfolio.

TICKER/ Score/ Vector/ % Profit/Loss of position
AMT/ 3/ Declining/-7.43%
MA/ 2/ Declining/-4.26%
WMT/ 4/ Ascending/-4.93%
CAT/ 3/ Ascending/-2.56%
PEP/ 2/ Ascending/-2.32%
MMM/ 2/ Ascending/-1.72%
AIG/ 1/ Ascending/-1.53%
HON/ 4/ Ascending/-1.16%
TMUS/ 4/ Descending/-0.71%
KHC/ 4/ Ascending/0.39%
DUK/ 4/ Ascending/1.08%
LMT/ 4/ Ascending/0.95%
IBM/ 4/ Ascending/1.42%
T/ 4/ Ascending/3.72%
TGT/ 3/ Descending/-6.09%
GD/ 3/ Ascending/-0.98%
DOW/ 3/ Descending/-0.97%
CL/ 3/ Ascending/-4.34%
WM/ 3/ Ascending/3.44%

There is one small issue I noticed with my method. As you can see I bought AIG this past week but by Friday the momentum score of AIG was down to 1 which triggers the sell rule. In order to reduce whipsaws, I purposely set the time frame to be medium long of 60 days, which covers 2 months. This got me thinking, of substituting the ADX indicator with RRG momentum indicator ROC. Thus I will pick those stocks whose momentum vector is improving w.r.t other stocks in the group. I am using the SP100 index ETF OEF as control for the group. Hopefully this will reduce the short in-out trades which I do not want to engage in.

Thanks for reading!

Next post will be end of week 19, on or about May 14, 2022. Until then keep tracking the momentum!


Sunday, May 1, 2022

Momentum Analytics Portfolio update end of week ending April 29,2022

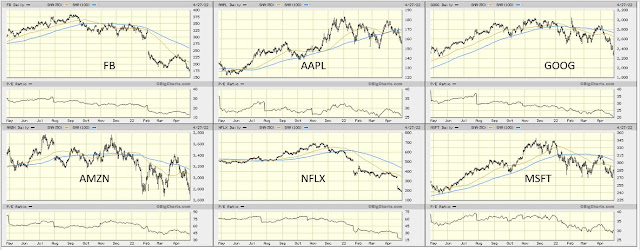
This week was miserable in the equities market. I feel that the momentum portfolio did just as well (or badly) or better (less poorly) than broad markets. But what a fricking sell off. Year to date, SPY (SP500) is down 12.99%, QQQ which tracks Nasdaq is down 21.17% and DIA which tracks the DOW 30 index is down 8.81%. This is perhaps the first clue into what markets have better momentum versus which sectors are doing poorly. 

Results by month since start of momentum investing

Here are the month-to-month results of the portfolio 

Month             total return                personal return             index return 

Mar                 3.72%                         2.68%                             3.67%

Apr                 0.55%                         -1.85%                            -9.09%

I use Morningstar to track my portfolio returns. According to Morningstar,

Total Return Total Return measures the theoretical performance of your holdings for a specified period of time, taking into account the beginning and end values of your investments as well as dividends. 

Personal Return Personal Return calculates the investor's returns, taking into account an additional factor in its calculation: the capital that you added or withdrew from your fund or portfolio throughout the specified period of time. The calculation of Personal Return illustrates how your allocation of capital has affected the performance of your portfolio. 

As seen in the returns comparison, the momentum portfolio has done well this week compared to the total US market index.

Positions and Positions Sizes

This bring us to the positions in my portfolio.

Momentum Analytics portfolio positions

The positions are their momentum scores are reported below

Name (Ticker, Composite momentum score)

1) American Tower Corp. (AMT, 2): AMT belongs to the real estate sector and specialty REIT industry. The specialty REIT industry is doing well this may provide the tailwinds that the company needs to sustain the long position. The Composite momentum score has been generally in the bullish zone since April 1st but tipped into the score 2 after the market meltdown on Friday. The price action has not been keeping up with the bullishness and I hope this represents a pullback and that the price will bounce back.

2) AT& T Inc (T, 4): T belongs to the communication services sector and Fixed telecommunications industry. The Fixed telecommunications industry is doing well recently April 21, 2022 and this may provide the tail winds for the company.  The Composite momentum score has been overall bullish since April 8th, 2022 the price action has been tracking sideways and hopefully indicates accumulation and further price increase.

3) Colgate-Palmolive Co (CL, 3): CL belongs to the consumer staples sector and personal products industry. The personal products industry is doing better than the average market this may provide the tailwinds for the company.  The Composite momentum score has been bullish recently but has dipped into the HOLD (2) category since the market drop this Friday. Hopefully, this represents, resistance to further drop and the momentum is able to bring price back into the favorable position. If score falls further, it will trigger the sell rule.

4) Dow Inc (DOW, 3): DOW belongs to the Materials sector and Commodity chemicals industry. The commodity chemicals industry is doing well since April 7 and this may provide the tailwinds for the company.  The Composite momentum score has been bullish since January 13, 2022.  The price action has been keeping up with the bullishness and I hope the recent drop represents a minor pullback

5) General Dynamics Corp (GD, 3): GD belongs to the Industrial sector and defense industry. The defense industry is doing well since January 14th and this may provide the tailwinds for the company. The Ukraine-Russia war is clear factor in the surging of the defense industry. The Composite momentum score has been bullish since January 13th, 2022. The price action has been keeping up with the bullishness and I hope the recent drop represents a minor pullback. 

6) International Business Machines Corp (IBM, 3): IBM belongs to the Technology sector and computer services industry. The computer services industry is doing poorly overall but perhaps a small blip of improvement as of April 22nd, 2022. The Composite momentum score has been bullish only recently since April 20th, 2022. I anticipate this may fall back to HOLD category, then if the momentum were to continue, would take up again from there. 

7) PepsiCo Inc (PEP, 2): PEP belongs to the consumer staples sector and soft drinks industry. The soft drinks industry is doing really well  since January 3, 2022. The Composite momentum score has been bullish  since April 20th, 2022 but fell to HOLD on last Friday.

8) Procter & Gamble Co (PG, 2): PG belongs to consumer staples, personal products industry. This industry has been only recently since April 22 doing better than its performance compared to the total market. Also PG is one of few on this list that has moved up in ranks from a bearish category to HOLD and then briefly a bullish score of 3, early part of last week. Friday sell off in the general market put it back into the HOLD but on the long side. 

9) Raytheon Technologies Corp (RTX, 3): RTX belongs to Industrial sector, Aerospace industry. This industry as a whole as weakening momentum compared to its performance w.r.t total market. The ticker has been bullish since February 2 but I need to keep a close eye on this one. I am afraid the slowing momentum and weakening industry performance may trigger a sell signal, but lets see what the rules have to say when the time comes.

10) Target Corp (TGT, 3): TGT is in the consumer discretionary sector, broad line retailers industry. This industry has had a weak performance compared to the broader market indexes. The ticker went bullish on April 8 but fell to a 3 category after the broad market sell off on 4/29/2022. 

11) The Kraft Heinz Co (KHC, 4): KHC belongs to consumer staples sector, food products industry. The stock price has had a robust momentum since February 15. Currently still at a score of 4 even with the market sell-off, has a ADX suggesting trending strength and tailwinds with industry performance, this stock has high chance of pulling back and stock price increase again. 

12) T-Mobile US Inc (TMUS, 3): TMUS belongs to communication services sector, mobile communications industry. It was doing well with a momentum score of 4, until the Friday sell-off where the momentum score fell to 3, still a bullish score. It turned bullish on February 3 and continues to range in the bullish score trend. The mobile telecommunications industry performance however, if weakening.

13) Walmart Inc (WMT, 4): WMT turned to a bullish momentum score on March 7th and has been strong bullish since. The momentum is strong and hopefully reflects a minor pullback w.r.t last Fridays price action and recovery in next few days. 


14) Waste Management Inc (WM, 4): WM belongs to industrial sector and waste and disposal industry. The scores turned to bullish on April 4 and continue to maintain a strong momentum.

Score classification

Score 0: Super bearish, no entry

Score 1: bearish, no entry

Score 2: if improving, not buying yet - "watchful for short reversal", if falling, not selling yet - "watch for long reversal"

Score 3: bullish, entry or hold

Score 4: bullish, entry or hold.

Sells

This week I sold TSLA at a small loss. Its score dropped from a 3 to 1 and I sold it for a 2.2% loss. 

Adds

This week I added GD, IBM, PEP, PG this week. CL is one I am watching closely, based on momentum score it is not yet time to sell but if it falls to 2 then I will sell it. At present all the positions are at a loss as reported below

Individual Stock Performance

Name (ticker, unrealized gain/loss)

American Tower Corp. (AMT, -8.59%)
AT&T Inc (T, -0.56%)
Colgate-Palmolive Co (CL, -4.08%)
Dow Inc (DOW, -2.7%)
General Dynamics Corp (GD, -2.04%)
International Business Machines Corp (IBM, -2.59%)
PepsiCo Inc (PEP, -1.58%)
Procter & Gamble Co (PG, -0.67%)
Raytheon Technologies Corp (RTX, -5.6%)
Target Corp (TGT, -5.96%)
The Kraft Heinz Co (KHC, 4)
T-Mobile US Inc (TMUS, -3.58%)
Walmart Inc (WMT, -2.75%)
Waste Management Inc (WM, +5.15%)

Next update 5/8/2022, until then keep tracking the momentum.

Wednesday, April 27, 2022

FAANG-M stocks, how they stack up: A momentum analytics study

Introduction

The five stocks that make up the FAANG-M are facebook/Meta (FB), Amazon (AMZN), Apple (AAPL), Netflix (NFLX), Alphabet (GOOG) and Microsoft (MSFT).

As of the time of writing this note, the SP500 is heavily tilted to these mega caps. Apple Inc  makes up 5.90% of the SP500 index, Microsoft Corp (5.60%), Amazon.com Inc (4.05%), Facebook Inc A (2.29%), Alphabet Inc/Google is 3.98% (between A and C class shares) 

Thus stock price changes in these companies can have a significant impact on the price of general market indexes. 

The price chart of the tickers in question is shown below (charts courtesy bigcharts.com). If you are familiar with the background you can skip the next few sections and go straight to the tabulated results. 

1 YEAR STOCK PRICE

Background

Price momentum is an observed tendency for a rising price of an asset to keep rising, and a falling price to keep falling. 

Thus stocks with strong performance tend to continue outperforming for the next set period. The period is important since a stock that is ripping today may not do so in 5 years. The effect of momentum is is best seen in the short and mid-term time frames. 

A little background on this concept is pinned as a tweet in my profile. 

https://pbs.twimg.com/media/FRKEZr9X0AMH4Py?format=png&name=small

Using a composite score derived from momentum indicators, I have set up rules based entry and exit signals. These allow me to buy and sell without much emotional wrangling. If the rule is met - buy, if the rule holds - hold and if the rule is broken - sell.

Vector direction and strength: 

Just as a vector (in physics) has direction and strength, the price movement has direction and strength. 

Based on the 4 medium term indicators for direction of the price movement (bullish versus bearish) and 1 indicator for the strength of the price movement, I am able to break down price action of any stock to one of 5 grades or scores.

Score 0: Highly bearish
Score 1: Bearish
Score 2: Neither bullish nor bearish
Score 3: Bullish
Score 4: Strongly bullish

Score of 0 and 4 have the added caveat of watching for reversals as with any extreme price movements. With this basic information lets analyze the momentum for the 6 stocks in question

The Indicators:

As a gauge of direction (bullish or bearish), I am using a 60 day period RSI (relative strength Index), MACD (Moving averages convergence divergence), MFI (Money flow index) and Rate of change (ROC). As a gauge of strength I am using a 14 day ADX (average directional index) but, I do not incorporate it in the calculation of the score. The ADX is only to inform if there is going to be strong up or down movement possible or if the price is going to slowly trend sideways

RSI and ROC are pure price momentum indicators, one is range bound (0-100) and other is not. MFI is a price and volume momentum indicator which is also range bound. MACD is both leading and lagging indicator based on price. Thus, it is expected that the 4 indicators would provide a different input and it is important that they NOT have a correlation of 1. 

Application of rules

When the momentum score is 0 of 1, it not an ideal time to add or initiate a position. When the score improves to 2, the ticker could be on a watch list and a good entry point is when score improves to 3 or 4. As long as the price stays 3 or 4, one could hold the position When the price momentum slows to bearish and falls to 1 or 0, sell signal comes on.

Results

Thus as of today, none of the megacaps are showing a buy signal. Amazon is on watch and faring better than the rest.

Popular Posts