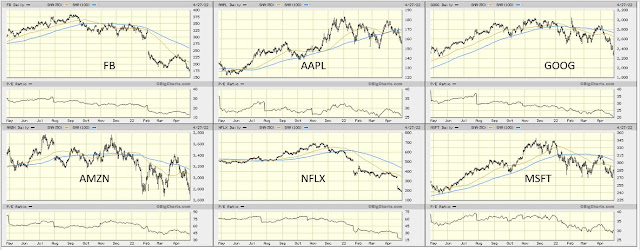
The five stocks that make up the FAANG-M are facebook/Meta (FB), Amazon (AMZN), Apple (AAPL), Netflix (NFLX), Alphabet (GOOG) and Microsoft (MSFT).
As of the time of writing this note, the SP500 is heavily tilted to these mega caps. Apple Incmakes up 5.90% of the SP500 index, Microsoft Corp (5.60%), Amazon.com Inc (4.05%), Facebook Inc A (2.29%), Alphabet Inc/Google is 3.98% (between A and C class shares)
Thus stock price changes in these companies can have a significant impact on the price of general market indexes.
The price chart of the tickers in question is shown below (charts courtesy bigcharts.com). If you are familiar with the background you can skip the next few sections and go straight to the tabulated results.
1 YEAR STOCK PRICE
Background
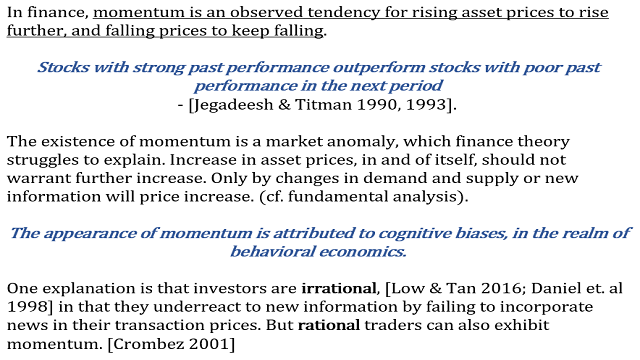
Price momentum is an observed tendency for a rising price of an asset to keep rising, and a falling price to keep falling.
Thus stocks with strong performance tend to continue outperforming for the next set period. The period is important since a stock that is ripping today may not do so in 5 years. The effect of momentum is is best seen in the short and mid-term time frames.
Using a composite score derived from momentum indicators, I have set up rules based entry and exit signals. These allow me to buy and sell without much emotional wrangling. If the rule is met - buy, if the rule holds - hold and if the rule is broken - sell.
Vector direction and strength:
Just as a vector (in physics) has direction and strength, the price movement has direction and strength.
Based on the 4 medium term indicators for direction of the price movement (bullish versus bearish) and 1 indicator for the strength of the price movement, I am able to break down price action of any stock to one of 5 grades or scores.
Score of 0 and 4 have the added caveat of watching for reversals as with any extreme price movements. With this basic information lets analyze the momentum for the 6 stocks in question
The Indicators:
As a gauge of direction (bullish or bearish), I am using a 60 day period RSI (relative strength Index), MACD (Moving averages convergence divergence), MFI (Money flow index) and Rate of change (ROC). As a gauge of strength I am using a 14 day ADX (average directional index) but, I do not incorporate it in the calculation of the score. The ADX is only to inform if there is going to be strong up or down movement possible or if the price is going to slowly trend sideways
RSI and ROC are pure price momentum indicators, one is range bound (0-100) and other is not. MFI is a price and volume momentum indicator which is also range bound. MACD is both leading and lagging indicator based on price. Thus, it is expected that the 4 indicators would provide a different input and it is important that they NOT have a correlation of 1.
Application of rules
When the momentum score is 0 of 1, it not an ideal time to add or initiate a position. When the score improves to 2, the ticker could be on a watch list and a good entry point is when score improves to 3 or 4. As long as the price stays 3 or 4, one could hold the position When the price momentum slows to bearish and falls to 1 or 0, sell signal comes on.
Results
Thus as of today, none of the megacaps are showing a buy signal. Amazon is on watch and faring better than the rest.
Here
in is presented a novel method to analyze underlying business to
understand connections, synergies, scale, shared strategic resources
& inter-dependencies that may make UPST a stellar company.
This
type of analysis is complementary to the conventional methods of
fundamental or technical analysis, and lets semantic data reveal the
patterns and relationships. Connect the dots.
Based
on my concept analysis, Upstart Inc is a disruptor, filling an unmet
need. It has the vision and an operating mechanism for growth.
anilakkus/E+ via Getty Images
A deep dive into Upstart Holdings Inc. (Ticker: UPST). Network analysis of concepts fiscal quarter end June 2021.
Introduction
There are many services that provide stock or company analysis, those
analysts choose either fundamental data (numbers like profit, loss,
revenue etc.) or technical analysis (stock price action) which are
important for evaluation of the company. This article is not it.
This article presents a method to understand the
underlying business and to get a sense of connections, synergies, scale,
interconnections, shared strategic resources and inter-dependencies
that make a company successful.
Background
In graph theory, a graph (network) is a
structure containing a set of objects in which the objects are in some
sense “related”. The objects can be ideas, concepts, discrete elements. I
use visual and network analysis in medicine and biology to analyze
relationships between proteins, genes, diseases etc. I am applying
similar principles to do deep dives of companies to analyze companies to
invest in.
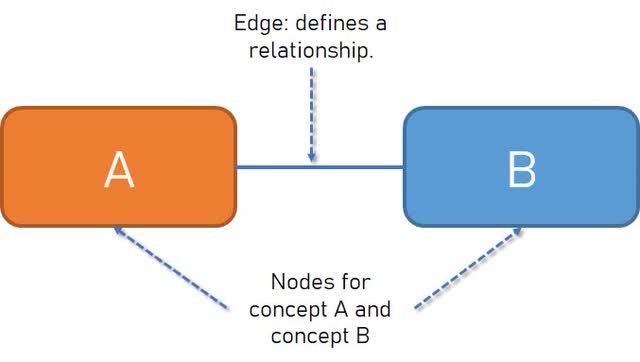
A network graph is made of nodes and connections (edges). Each
node is a tangible concept or entity. Lines connecting the nodes are
relationships between any two entities are called edges. Thus, if 2
entities are related, there is a line (edge) connecting 2 nodes. In the
most reductive sense, this is represented in the figure 1, with 2 nodes
and 1 edge. This type graph is an excellent tool to represent
relationships between 2 ‘concepts’.
Figure 1: A simple network, concept nodes (A and B) connected by an edge relation
veuepoint (self)
These
graphs are a non-random mathematical models of relationships. This
process is unsupervised (no human bias) and lets the data reveal the
patterns and relationships , allowing confirmation of the known and to
reveal the unknown.
Such tools can help increase understanding and reading between the
lines. In my opinion, this type of analysis is crucial but severely
lacking. Intangibles like company work culture, mission, flywheels,
synergies, leadership can be “discovered” by such tools. With this
background, lets analyze the concepts presented in the conference call for fiscal quarter ending June 2021 (UPST)
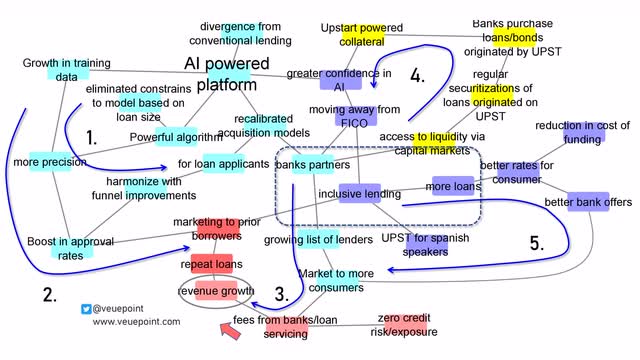
Unsupervised concept network analysis of Upstart and its AI platform
Figure 2: The entire unsupervised network of concepts related to Upstart AI platform
Veuepoint (self)
The above figure is busy so let me break it down into ‘smaller models’ which lets us look at it in detail.
Figure 2A: Upstart AI platform concept analysis closer look at concepts 1, 2 and 3
Veuepoint.com (self)
1) A platform (and the business) which gets better over time.
This section of the network model shows the amazing internal
flywheels that are synergistic to the workings of Upstart. Lets begin
with our attention to the left of the figure (blue arrow #1). This
section describes the AI platform and the developments that upstart has
implemented for it. The AI platform is a self learning entity, the more
data it processes the better it gets at making decisions. This growth in
training data leads to more precision and then in turn leads to a boost
in approval rates for applicants. This leads to more loans being
approved which in turn leads to refinement of the algorithm. Thus one
can envision, this process to get better and better over time, and be
able to identify those applicants which are loan worthy but missed by
other scores (Like FICO).
2) Revenue growth multipliers
The next concept that is evident from the network map is shown by
blue arrow #2. Here the improvement in AI algorithm, translates to
revenue growth. This is achieved by the intermediary steps of increased
precision, leading to boost in approval rates, leading to approving more
borrowers. The company also has stated emphasis on marketing to prior
borrowers. This is an excellent strategy since they have already
qualified by upstarts AI and have demonstrated the ability to pay back
the loans. These repeat loaners add to revenue growth.
3) Increase in lenders adds to borrower related revenue growth
The third network concept is highlighted by blue arrow #3. This
revenue growth is not only being increased by growth in first time and
repeat loan applicants, it is also growing as the number of lenders
increases. This allows the banks to market to more consumers and this
provides fees from banks for loan servicing (Blue arrow #3). The
important aspect of this revenue stream is that Upstart is able to
achieve this growth with zero credit risk or exposure. This is borne by
banks and not by Upstart.
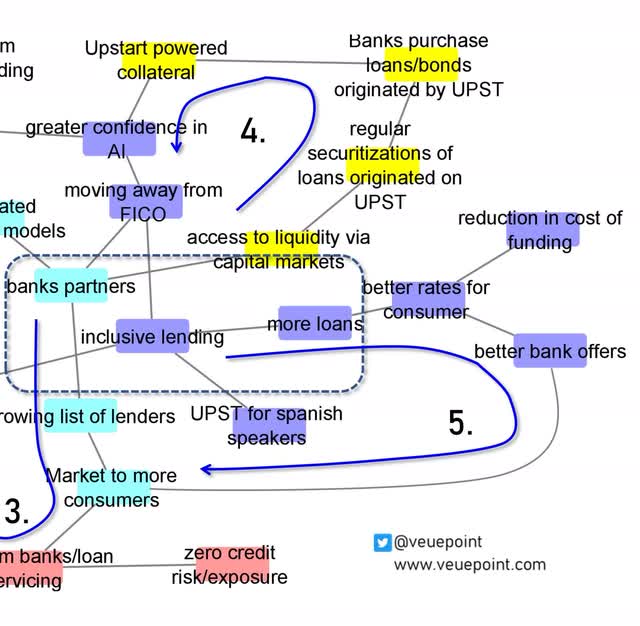
Figure 2B: Upstart AI platform concept analysis closer look at concepts 4 and 5
Veuepoint.com (Self)
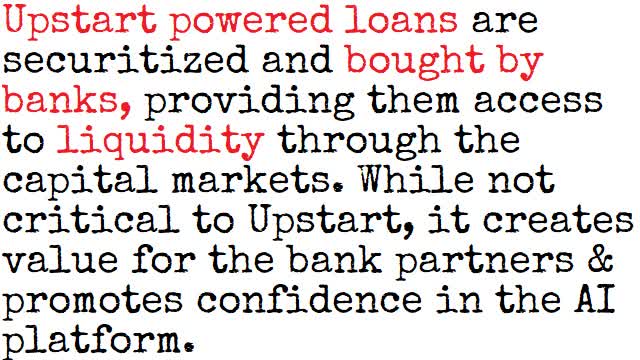
4) Upstart powers collateral that partner banks can use
The fourth segment of this network is the part in yellow on top right
and is an interesting one. Upstart is able to provide access to
liquidity to banks by exposure to capital markets. The loans that
originate at Upstart can be “securitized” and sold to banks
that are willing to buy them. This upstart “powered” collateral that
banks have (bonds, loans), allows banks access to more liquidity and
capital.
Concept card 1: liquidity and access to capital markets
Veuepoint.com (self)
This
is not necessary for working of upstart but provides an excellent
service and value to the partner banks. This increases the working
relationship that banks have with Upstart. This also has another
benefit, as banks work with this upstart originated collateral, they are
also demonstrating greater confidence in AI platform and this has lead
to some banks discontinuing legacy scoring systems like FICO altogether.
That is an exceptionally disruptive nature of the this arrangement.
5) "Inclusivity" revealed as the central tenet
The last segment of the network are the purple nodes on the right,
this deals with the nature of the platform and its goal of inclusivity.
As more loans are offered, upstart and bank partners are able to offer
better rates to the consumer, leading to better offers from the bank and
overall reduction in cost of funding the loan. This is a virtuous cycle
which keeps working to improve at each iteration, lend more, to more
eligible applicants and have them and banks get a better deal out of the
transaction.
The network began with AI powered platform as the starting node.
However, when all the concepts were linked and connected, the central
nodes that seem to be the crux of the graph are bank partners – inclusive lending – more loans.
This tenet is central to the working of the company and the network map
generated by unsupervised non-random modeling was able to pin it down
to this. Their mission to enable effortless credit based on true risk is
acted on by a culture of “inclusive lending”.
Their modus operandi is exemplified by their mission statement “to enable effortless credit based on true risk. We are a leading artificial intelligence (NYSE:AI)
lending platform designed to improve access to affordable credit while
reducing the risk and costs of lending for our bank partners. Our
platform uses sophisticated machine learning models to more accurately
identify risk and approve more applicants than traditional, credit-score
based lending models.”
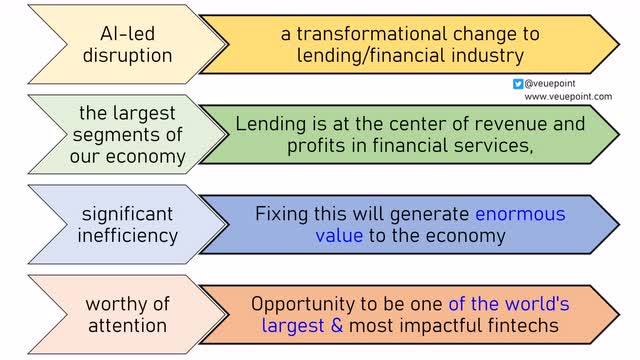
Concept card 2: Upstart Key drivers and consequences
Veuepoint.com (self)
As
seen in the figure above, the key concepts that drive Upstart have huge
consequences. Lending is the center of revenue and profits in financial
services. This is one of the largest segments of the economy. However,
lending is fraught with inefficiencies. Artificial intelligence can
assist in eliminating these inefficiencies. This can generate enormous
value to the economy. AI powered lending could be the most
transformational change for this industry and provides Upstart the
opportunity to become one of the world’s largest and most impactful
fintechs in the years to come.
But wait there is more..
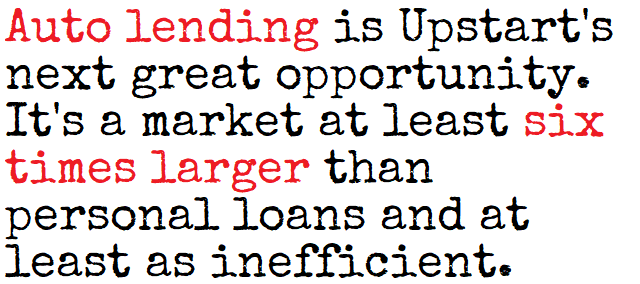
Upstart auto lending could be the new hyper-growth venture.
Concept card 3: Autolending is larger than Personal loans
Veuepoint.com (Self)
Upstart (UPST)
recognizes the potential for growth in a related business by applying
similar principles as personal loans to car loans. The figure below
shows network model of concepts for auto lending. I will discuss key
themes that stood out.
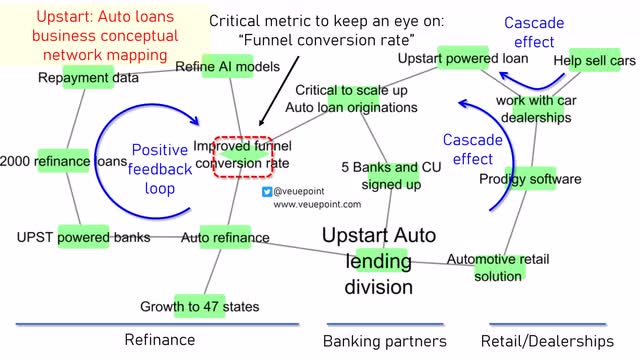
Figure 3: Auto lending segment and Upstart concept network mapping
Veuepoint.com (Self)
A positive feed back loop
The auto refinance sector, via upstart powered banks offer loans to
applicants. This is also based off their Artificial intelligence
algorithm which makes a determination of eligibility just as it does in
the personal loans space. As of their earnings update in August 2021,
they had 2000 loans. The repayment data from these loans is utilized to
refine the AI models, which can then in turn improve the funnel conversion rate. This is the rate of applicants who are approved for a loan over total number of applicants.
The company will continue to do exceptionally well, provided the
percentage of applicants who are approved compared to the total
applicants continues to grow. This will in turn increase the data of
loan applicants, repayment data and further refine the AI to improve the
detection on ideal applicants. This is noted as a “positive feedback
loop” or a “flywheel effect”, similar to what was seen in the personal
loans space. The best thing about this, is that the system keeps
learning over time to better itself and make decisions with even better
accuracy. The funnel conversion rate (noted as a diamond node) is a critical lynch pin in this network graph, since the positive loop is sustained only if the funnel conversion rate is positive and keeps improving.
A cascade effect of Prodigy, car dealerships and car loans
The second section of their auto lending concept map is the effect of
Prodigy and its association with car dealerships (shown on right hand
side of figure 4). Prodigy works with car dealerships to assist these
businesses sell cars. It claims to streamline the process of car
selling. The synergistic benefit of prodigy working with dealers
to sell more cars is brought forth when a portion of these cars sold
will also be financed through a upstart powered loan. The more
cars prodigy helps sell, the more loans upstart can provide using its
algorithm. This aspect of upstart is nascent and will continue to grow
as more and more banks and credit unions sign up.
Overall, the concept maps exhibits good internal synergies and are sentiment positive.
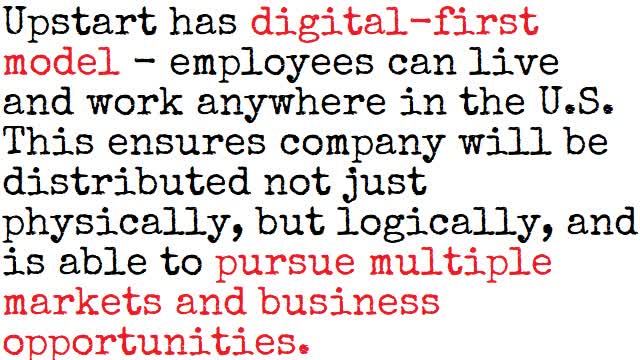
A note on the work place philosophy at Upstart as a company.
Upstart is moving to a “digital-first model”, where
most employees can live and work anywhere in the U.S. Besides the usual
reasons for why hybrid or work from home has advantages for a place like
Upstart, I would like to highlight a statement which is quite powerful as to the vision of what this company plans to do. “Given the scale of our ambitions and the talent we need to aggressively pursue our goals, we need to tap into talent across the entire country”
Concept card 4: Upstart and digital first model
Veuepoint.com (Self)
Conclusions
The semantic/concept network mapping has revealed several unique strengths and none critical deficiencies
Actionable considerations
The above article is not financial or investment advice. It is
sharing my method of evaluating companies. I have worked with network
graphs for more than a decade with applications to other field, this is
the first foray to publish its application to company analysis formally.
Comments and feed back are welcome.
Based on my concept analysis, Upstart Inc is a disruptor, filling an
unmet need. It has the vision and an operating mechanism for growth. I
am invested in Upstart. The company narrative is exceptional and as long
as this narrative continues, I will stay invested.
Disclosure: I/we have a beneficial long position in the shares of UPST either through stock ownership, options, or other derivatives.
I
wrote this article myself, and it expresses my own opinions. I am not
receiving compensation for it. I have no business relationship with any
company whose stock is mentioned in this article